在 OceanBase 运维中,“数据空洞” 是随机写场景下的常见痛点 —— 本次案例中,我们通过定位宏块利用率→排除其他诱因→执行全量合并的流程,成功将高空洞表的宏块利用率从14%提升至97%,存储占用从14T降至2.4T。
问题现象
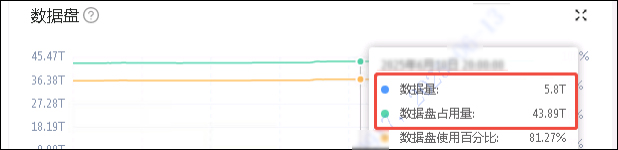
生产环境中,业务侧反馈“数据量没涨多少,但磁盘快满了”。技术团队通过监控发现:实际生产数据与存储占用空间数据,两者差异悬殊,数据空洞问题十分明显,如下图所示。
问题排查
数据空洞的常见诱因包括“宏块利用率低”“多版本数据残留”“重复基线存储” 等,逐一排查验证:
查看磁盘使用率:确认当前数据占用空间为2T,而磁盘使用为14T
obclient [oceanbase]> select   svr_ip,svr_port, sum(occupy_size)/1024/1024/1024 as occupy_size_G,sum(used_size) /1024/1024/1024 as used_size_G from __a
ll_virtual_storage_stat group by 1,2;
+------------+----------+-------------------+--------------------+
| svr_ip  | svr_port | occupy_size_G     | used_size_G        |
+------------+----------+-------------------+--------------------+
| xx.67 |     2882 | 2034.665067771449 | 14277.343750000000 |
| xx.66 |     2882 | 2034.665092909708 | 14277.378906250000 |
| xx.68 |     2882 | 2034.665058692917 | 14277.353515625000 |
+------------+----------+-------------------+--------------------+
3 rows in set (0.100 sec)
检查宏块利用率:宏块利用率为14%,确认是由于宏块利用率低引起的数据空洞问题
obclient [oceanbase]> select svr_ip,sum(occupy_size)/1024/1024/1024 data_dize,count(*)*2/1024 macro_size,sum(occupy_size)/(count(*)*2*1024*1024) rate from __all_virtual_partition_sstable_macro_info group by svr_ip;
+------------+-------------------+------------+--------+
| svr_ip     | data_dize         | macro_size | rate   |
+------------+-------------------+------------+--------+
| xx.66 | 2034.665092909708 | 14277.3789 | 0.1425 |
| xx.67 | 2034.665067771449 | 14277.3438 | 0.1425 |
| xx.68 | 2034.665058692917 | 14277.3535 | 0.1425 |
+------------+-------------------+------------+--------+
3 rows in set (22.178 sec)
检查基线数据:检查是否转储或者保存多个基线数据导致宏块利用率低,该节点上转储数据并不多,table_type=1表示已经完成合并的数据
obclient [oceanbase]> select table_type,sum(size)/1024/1024/1024 as size_G from __all_virtual_table_mgr where svr_ip = 'xx.66' and table_type > 0 group by 1 order by 2 desc;
+------------+-------------------+
| table_type | size_G            |
+------------+-------------------+
|          1 | 2034.664065995253 |
|          7 |    0.001012180932 |
|          3 |    0.000033218413 |
|          5 |    0.000014733522 |
+------------+-------------------+
4 rows in set (0.170 sec)
检查数据版本:检查是否保留了多个版本的数据
bclient [oceanbase]> select version,sum(size)/1024/1024/1024 as size_G from __all_virtual_table_mgr where table_type=1 group by 1 order by 2 desc;
+---------+-------------------+
| version | size_G            |
+---------+-------------------+
|     599 | 6103.992197985761 |
+---------+-------------------+
1 row in set (0.148 sec)
经过上述分析,排除多基线、多版本因素,已基本确认数据空洞问题根源是由于宏块使用率低导致。
问题原因
宏块使用率低的核心诱因是大量随机写,我们用一个简单例子解释:
比如sstable有一个宏块A是有1-100(假设一个宏块只能存放1-100),那么这个宏块利用率是满的。假如后续再进来150-200 那么存放到B宏块(B宏块没满),B宏块有空洞,同理后续C、D宏块都会因为这个原因产生空洞。
解决方案
数据空洞无法完全消除,有随机写的情况就会有数据空洞发生,跟数据分布和分区策略、索引设计等都有关联。因此建议周期性的对某些表进行一次全量合并,具体的操作方式如下:
obclient [oceanbase]> select table_id,count(1), 2*count(1)/1024 as size_G,sum(occupy_size)/1024/1024/1024 as occupy_G from __all_virtual_partition_sstable_macro_info where svr_ip='xx.66' and data_version = 599 and tenant_id = 1004 group by 1 order by 2 desc limit 30;
+------------------+----------+-----------+------------------+
| table_id         | count(1) | size_G    | occupy_G         |
+------------------+----------+-----------+------------------+
| 1103909674353135 |  1829363 | 3572.9746 | 143.247554606758 |
| 1103909674351571 |   377756 |  737.8047 |  49.224974008276 |
| 1103909674351903 |   317426 |  619.9727 |  35.896740995347 |
| 1103909674351840 |   295446 |  577.0430 |  21.044767114333 |
| 1103909674350445 |   269706 |  526.7695 |  31.650324021466 |
| 1103909674350510 |   232109 |  453.3379 |  25.601752864196 |
| 1103909674352595 |   218629 |  427.0098 |  63.221858207136 |
| 1103909674350757 |   198471 |  387.6387 |  26.605528677813 |
| 1103909674350575 |   165032 |  322.3281 |  15.150384083390 |
| 1103909674352377 |   137649 |  268.8457 |  13.086283571086 |
| 1103909674352073 |   125504 |  245.1250 | 244.387187873013 |
| 1103909674351451 |   109867 |  214.5840 |  18.289974263869 |
| 1103909674353171 |    97790 |  190.9961 |   9.750532369129 |
| 1103909674351426 |    95553 |  186.6270 |  12.395871756598 |
| 1103909674350943 |    88913 |  173.6582 |  13.170437745749 |
| 1103909674352637 |    87866 |  171.6133 |  13.042806427926 |
| 1103909674352686 |    85815 |  167.6074 |  62.268563260324 |
| 1103909674352439 |    72924 |  142.4297 |  12.102238557301 |
| 1103909674352350 |    70186 |  137.0820 |  20.073601464740 |
| 1103909674352090 |    63682 |  124.3789 |   7.402590181678 |
| 1103909674351611 |    61148 |  119.4297 |   7.629764789715 |
| 1103909674353010 |    59824 |  116.8438 |  13.362392924726 |
| 1103909674350876 |    59816 |  116.8281 |   6.147240398451 |
| 1103909674351374 |    59059 |  115.3496 |   6.598102170042 |
| 1103909674352520 |    59017 |  115.2676 |   7.026257126592 |
| 1103909674351406 |    53120 |  103.7500 |   8.133849042467 |
| 1103909674351753 |    52587 |  102.7090 |   7.824567818082 |
| 1103909674352951 |    52044 |  101.6484 |   5.062313280067 |
| 1103909674351066 |    51749 |  101.0723 |   4.977780955843 |
| 1103909674350971 |    47921 |   93.5957 |  16.087242195382 |
+------------------+----------+-----------+------------------+
30 rows in set (16.481 sec)
根据table_id匹配到对应的table_name,并指定这些表的合并方式为全量合并
alter table table_name set progressive_merge_num = 1;
下次合并完成后再将合并方式设置回默认值
查看完成全量合并后,表的数据空洞问题是否还存在
select table_id,count(1), 2*count(1)/1024 as size_G,sum(occupy_size)/1024/1024/1024 as occupy_G from __all_virtual_partition_sstable_macro_info where svr_ip='xx.66' and data_version = 599 and tenant_id = 1004 and table_id = '1103909674353204' group by 1 order by 2 desc limit 30;
client [oceanbase]> select table_id,count(1), 2*count(1)/1024 as size_G,sum(occupy_size)/1024/1024/1024 as occupy_G from __all_virtual_partition_ssta
ble_macro_info where svr_ip='xx.66' and data_version = 599 and tenant_id = 1004 and table_id = '1103909674353204' group by 1 order by 2 desc limit
 30;
+------------------+----------+--------+----------------+
| table_id         | count(1) | size_G | occupy_G       |
+------------------+----------+--------+----------------+
| 1103909674353204 |     1234 | 2.4102 | 2.338463457301 |
+------------------+----------+--------+----------------+
1 row in set (11.507 sec)
验证结果:处理后的表,宏块总容量(2.41GB)与实际数据量(2.34GB)基本持平,数据空洞已显著缓解。
运维的核心不是“消除问题”,而是“找到规律、有效缓解”——希望本次排查实录,能为你的 OB 运维工作提供一份可复用的方案。如果你也遇到类似问题,欢迎在评论区交流排查经验,下次见~